Think Maintenance in RelationshipsWell, you guessed it, this short article is a reminder of the importance of maintaining relationships, either with co-workers, loved ones…Mar 29, 2021Mar 29, 2021
Are Digital Marketing Metrics Important?Are digital marketing metrics important? Yes, and no., Let me explain. Alone, digital marketing metrics are useless. There is no point in…Mar 18, 2021Mar 18, 2021
SEO Starter GuideIf you are wondering how to deal with SEOs (search engine optimization), and how to get started quickly and effectively, well, this…Feb 23, 2021Feb 23, 2021
What is critical thinking?Critical thinking is a process to define, investigate, and assess a situation that could be a conflict, claim, argument, etc.May 19, 2020May 19, 2020
Age and politicsI guess you have heard about Sanna Marin, the youngest prime minister from Finland? Sanna Marin is merely 34 years old and yet is a prime…Jan 16, 2020Jan 16, 2020
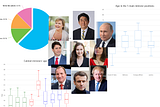
Exploratory data analysis with each data type (part 2)… This article is the continuation of the Exploratory data analysis with each data type (part 1) …Dec 4, 2019Dec 4, 2019
Exploratory data analysis with each data type (part 1)In this article, I will share with you examples of how to explore empirical data using statistics and different data visualization. This…Dec 4, 2019Dec 4, 2019
Data TypesIf you are wondering how to deal with data, how to explore it, and how to visualize it, well, this article is for you.Dec 4, 2019Dec 4, 2019
Solved: Sequel Pro connection failed!I had this little error message that got me crazy for a while:Aug 6, 2019Aug 6, 2019
How to use Wikipedia API with NodejsWikipedia has an enormous data set such as page view statistics, tables, etc. And in this article, I will show you how to access the…May 21, 2018May 21, 2018
Getting data from the WebIn this article, I will show you a nice and clever way to get/copy a table from a Wikipedia web page, using a simple JavaScript syntax. If…Jan 20, 20182Jan 20, 20182
Data visualization trick: Make every country on a map the same sizeSize differences between countries can overpower other stories in your data. Here a trick to fix this.Jul 23, 2017Jul 23, 2017
The 7 Most Common Chart MistakesDiscover how to avoid the most common mistakes in data visualization …Jul 23, 2017Jul 23, 2017
5 steps to create an effective data visualizationDo you know how to create an effective data visualization? Learn more here about a simple 5 steps process to create a powerful data…Jul 23, 2017Jul 23, 2017
Two stories to every chartIt is said that every story has two sides. In our world, every chart has two stories, the story that the chart tells, and the story about…Jul 23, 2017Jul 23, 2017
Create mobile charts with Highcharts iOSLearn how to create interactive mobile native app charts with Highcharts iOS.Jul 23, 2017Jul 23, 2017
After the brief definition above of the main service models of the cloud computing, let’s take a…<iframe class=”highcharts-iframe” src=”//cloud.highcharts.com/embed/yhalog” style=”border: 0; width: 100%; height: 500px”></iframe>May 5, 2015May 5, 2015